WARNING there have been reports of apps being rejected when Reachability is used in a framework. The only solution to this so far is to rename the class.
Reachability
This is a drop-in replacement for Apple’s Reachability class. It is ARC-compatible, and it uses the new GCD methods to notify of network interface changes.
In addition to the standard NSNotification, it supports the use of blocks for when the network becomes reachable and unreachable.
Finally, you can specify whether a WWAN connection is considered “reachable”.
DO NOT OPEN BUGS UNTIL YOU HAVE TESTED ON DEVICE
BEFORE YOU OPEN A BUG ABOUT iOS6/iOS5 build errors, use Tag 3.2 or 3.1 as they support assign types
Requirements
Once you have added the .h/m files to your project, simply:
Go to the Project->TARGETS->Build Phases->Link Binary With Libraries.
Press the plus in the lower left of the list.
Add SystemConfiguration.framework.
Boom, you’re done.
Examples
Block Example
This sample uses blocks to notify when the interface state has changed. The blocks will be called on a BACKGROUND THREAD, so you need to dispatch UI updates onto the main thread.
In Objective-C
// Allocate a reachability object
Reachability* reach = [Reachability reachabilityWithHostname:@"www.google.com"];
// Set the blocks
reach.reachableBlock = ^(Reachability*reach)
{
// keep in mind this is called on a background thread// and if you are updating the UI it needs to happen// on the main thread, like this:dispatch_async(dispatch_get_main_queue(), ^{
NSLog(@"REACHABLE!");
});
};
reach.unreachableBlock = ^(Reachability*reach)
{
NSLog(@"UNREACHABLE!");
};
// Start the notifier, which will cause the reachability object to retain itself!
[reach startNotifier];
In Swift 3
import Reachability
varreach:Reachability?func application(_ application:UIApplication, didFinishLaunchingWithOptions launchOptions:[UIApplicationLaunchOptionsKey:Any]?)->Bool{
// Allocate a reachability object
self.reach =Reachability.forInternetConnection()
// Set the blocks
self.reach!.reachableBlock ={(reach:Reachability?)->Voidin
// keep in mind this is called on a background thread
// and if you are updating the UI it needs to happen
// on the main thread, like this:
DispatchQueue.main.async{print("REACHABLE!")}}self.reach!.unreachableBlock ={(reach:Reachability?)->Voidinprint("UNREACHABLE!")}self.reach!.startNotifier()returntrue}
NSNotification Example
This sample will use NSNotifications to notify when the interface has changed. They will be delivered on the MAIN THREAD, so you can do UI updates from within the function.
In addition, it asks the Reachability object to consider the WWAN (3G/EDGE/CDMA) as a non-reachable connection (you might use this if you are writing a video streaming app, for example, to save the user’s data plan).
In Objective-C
// Allocate a reachability object
Reachability* reach = [Reachability reachabilityWithHostname:@"www.google.com"];
// Tell the reachability that we DON'T want to be reachable on 3G/EDGE/CDMA
reach.reachableOnWWAN = NO;
// Here we set up a NSNotification observer. The Reachability that caused the notification// is passed in the object parameter
[[NSNotificationCenterdefaultCenter] addObserver:selfselector:@selector(reachabilityChanged:)
name:kReachabilityChangedNotificationobject:nil];
[reach startNotifier];
In Swift 3
import Reachability
varreach:Reachability?func application(_ application:UIApplication, didFinishLaunchingWithOptions launchOptions:[UIApplicationLaunchOptionsKey:Any]?)->Bool{
// Allocate a reachability object
self.reach =Reachability.forInternetConnection()
// Tell the reachability that we DON'T want to be reachable on 3G/EDGE/CDMA
self.reach!.reachableOnWWAN =false
// Here we set up a NSNotification observer. The Reachability that caused the notification
// is passed in the object parameter
NotificationCenter.default.addObserver(self,
selector: #selector(reachabilityChanged),
name:NSNotification.Name.reachabilityChanged,
object:nil)self.reach!.startNotifier()returntrue}func reachabilityChanged(notification:NSNotification){ifself.reach!.isReachableViaWiFi() || self.reach!.isReachableViaWWAN(){print("Service available!!!")}else{print("No service available!!!")}}
val applicationContext: Application

val application: Application

val activityList: List<Activity>

val topActivity: Activity

val topActivityOrNull: Activity?

val topFragmentActivityOrNull: FragmentActivity?

val topActivityOrApplication: Context
Documentation is available on JitPack for the master branch.
Javadoc documentation can be generated by running the following command:
./gradlew javadoc
The HTML documentation will be placed in ./target/site/apidocs/index.html
HMAC+HKDF Authentication
HMAC+HKDF Authentication is an Authentication method that allows ensures the request is not tampered with in transit. This provides resiliance not only against network layer manipulation, but also man-in-the-middle attacks.
At a high level, an HMAC signature is created based upon the raw request body, the HTTP method, the URI (with query parameters, if present), and the current date. In addition to ensuring the request cannot be manipulated in transit, it also ensures that the request is timeboxed, effectively preventing replay attacks.
The library itself is made available by importing the following struct:
Supporting API’s will return the following payload containing at minimum the following information.
This string can be used in the Authorization Header
Date Header
The Version 1 HMAC header requires an additional X-Date header. The X-Date header can be retrieved by calling auth.getDateString()
Encrypted Requests & Responses
This library enables clients to establish and trusted encrypted session on top of a TLS layer, while simultaniously (and independently) providing the ability authenticate and identify a client via HMAC+HKDF style authentication.
The rationale for this functionality includes but is not limited to:
Need to ensure confidentiality of the Initial Key Material (IKM) provided by the server for HMAC+HKDF authentication
Need to ensure confidentiality of user submitted credentials to the API for authentication
The primary reason you may want to establish an encrypted session with the API itself is to ensure confidentiality of the IKM to prevent data leakages over untrusted networks to avoid information being exposed in a Cloudflare like incident (or any man-in-the-middle attack). Encrypted sessions enable you to utilize a service like Cloudflare should a memory leak occur again with confidence that the IKM and other secure data would not be exposed.
To encrypt, decrypt, sign, and verify messages, you’ll need to be able to generate the appropriate keys. Internally, this library uses lazysodium-java to perform all necessary cryptography functions, though any libsodium implementation for Java would suffice.
Encryption Keys
Encryption uses a sodium crypto box. A keypair can be generated as follows when using lazy-sodium.
importcom.ncryptf.Request;
importcom.ncryptf.exceptions.*;
importjava.util.Base64;
// Arbitrary string payloadStringpayload = "{\"foo\":\"bar\"}";
try {
// 32 byte secret and public key. Extract from kp.get...().getAsBytes(), or another libsodium methodRequestrequest = newRequest(secretKeyBytes, signingSecretKeyBytes/* token.signature */);
// Cipher now contains the encryted data// Signature should be the signature private key previously agreed upon with the sender// If you're using a `Token` object, this should be the `.signature` propertybyte[] cipher = request.encrypt(payload, remotePublicKey);
// Send as encrypted request bodyStringb64Body = Base64.getEncoder().encode(cipher);
// Do your http request here
} catch (EncryptionFailedExceptione) {
// Handle encryption errors here
}
Note that you need to have a pre-bootstrapped public key to encrypt data. For the v1 API, this is typically this is returned by /api/v1/server/otk.
Decrypting Responses
Responses from the server can be decrypted as follows:
importcom.ncryptf.Response;
importcom.ncryptf.exceptions.*;
importjava.util.Base64;
try {
// Grab the raw response from the serverbyte[] responseFromServer = Base64.getDecoder().decode("<HTTP-Response-Body>");
Responseresponse = newResponse(clientSecretKey);
Stringdecrypted = response.decrypt(responseFromServer, remotePublicKey);
} catch (InvalidChecksumExceptione) {
// Checksum is not valid. Request body was tampered with
} catch (InvalidSignatureExceptione) {
// Signature verification failed
} catch (DecryptionFailedExceptione) {
// Decryption failed. This may be an issue with the provided nonce, or keypair being used
}
V2 Encrypted Payload
Verison 2 works identical to the version 1 payload, with the exception that all components needed to decrypt the message are bundled within the payload itself, rather than broken out into separate headers. This alleviates developer concerns with needing to manage multiple headers.
The version 2 payload is described as follows. Each component is concatanated together.
42 libft is the first project of the common core, this project makes the student recreate some standard C library functions and some addition functions that will be useful throughout the cursus.
If you’re from 42 and you just started libft i highly recommend you to use this reposotory more as a support and develop your own functions and tests. If you need help you can send me a message in any of my socials
Standard C Library
Function
Description
Status
Francinette
ft_isalpha
Checks if the char received is a letter
✔️ ️
✔️
ft_isdigit
Checks if the char received is a number
✔️ ️
✔️
ft_isalnum
Checks if the char received is alphanumeric
✔️ ️
✔️
ft_isascii
Checks if the char received is an ascii char
✔️ ️
✔️
ft_isprint
Checks if the char received is printable
✔️ ️
✔️
ft_strlen
Returns the size of the string received
✔️ ️
✔️
ft_memset
Fills a block of memory with a particular value
✔️ ️
✔️
ft_bzero
Deletes the information of a set block of memory
✔️ ️
✔️
ft_memcpy
Copies the values of x bytes from source to the destination
✔️ ️
✔️
ft_memmove
Copies the values of x bytes from source to the destination
✔️ ️
✔️
ft_strlcpy
Copies from src to dest and returns the length of the string copied
✔️ ️
✔️
ft_strlcat
Concatnates dest with src and returns the length of the string concatnated
✔️ ️
✔️
ft_toupper
Converts into upercase the lowercase char received
✔️ ️
✔️
ft_tolower
Converts into lowercase the upercase char received
✔️ ️
✔️
ft_strchr
Returns the first occurance of char in the string
✔️ ️
✔️
ft_strrchr
Returns the last occurance of char in the string
✔️ ️
✔️
ft_strncmp
Compares the given strings up to n characters
✔️ ️
✔️
ft_memchr
Searchs in x bytes on a block of memory the first occurance of the value received
✔️ ️
✔️
ft_memcmp
Compares the first x bytes of a block of memory area str1 and str2
✔️ ️
✔️
ft_strnstr
Returns the first occurace of the little string on the big string
✔️ ️
✔️
ft_atoi
Converts the string received to it’s int value
✔️ ️
✔️
ft_calloc
Allocates a memory block with the size received and initializes it
✔️ ️
✔️
ft_strdup
Duplicates the string received on to a allocated string
✔️ ️
✔️
Addition functions
Function
Description
Status
Francinette
ft_substr
Returns an allocated string that starts at the index received
✔️ ️
✔️
ft_strjoin
Returns a new allocated string which is the result of the concatenation of both strings received
✔️ ️
✔️
ft_strtrim
Returns a copy of the string received without the characters received removing them from the beginning and end of the string
✔️ ️
✔️
ft_split
Returns a string separated by the character sent
✔️ ️
✔️
ft_itoa
Converts the int value received to it’s character value
✔️ ️
✔️
ft_strmapi
Applies the function received to each letter of the string received, creating a new allocated string with the changes
✔️ ️
✔️
ft_striteri
Applies the function received to each letter of the string received and replaces the string received with the changes
✔️ ️
✔️
ft_putchar_fd
Outputs the char received on to the file descriptor given
✔️ ️
✔️
ft_putstr_fd
Outputs the string received on to the file descriptor given
✔️ ️
✔️
ft_putendl_fd
Outputs the string received on to the file descriptor given and ending it with a new line
✔️ ️
✔️
ft_putnbr_fd
Outputs the number received on to the file descriptor given
✔️ ️
✔️
Bonus functions
Function
Description
Status
Francinette
ft_lstnew
Creates and return a new allocated node to a linked list
✔️ ️
✔️
ft_lstadd_front
Adds the node received to the beginning of a linked list
✔️ ️
✔️
ft_lstsize
Returns the number of nodes on a linked list
✔️ ️
✔️
ft_lstlast
Returns the last node of a linked list
✔️ ️
✔️
ft_lstadd_back
Adds the node received to the end of a linked list
✔️ ️
✔️
ft_lstdelone
Receives a node, deletes the contents of it’s variables and frees the node
✔️ ️
✔️
ft_lstclear
Deletes and frees the given node and every successor of that node
✔️ ️
✔️
ft_lstiter
Applies the function received to every element of the node’s variables
✔️ ️
✔️
ft_lstmap
Applis the function received to every element of the node’s variables and creates a new linked list from that
deb http://mirrors.aliyun.com/ubuntu/ focal main restricted universe multiverse
deb http://mirrors.aliyun.com/ubuntu/ focal-security main restricted universe multiverse
deb http://mirrors.aliyun.com/ubuntu/ focal-updates main restricted universe multiverse
deb http://mirrors.aliyun.com/ubuntu/ focal-proposed main restricted universe multiverse
deb http://mirrors.aliyun.com/ubuntu/ focal-backports main restricted universe multiverse
deb-src http://mirrors.aliyun.com/ubuntu/ focal main restricted universe multiverse
deb-src http://mirrors.aliyun.com/ubuntu/ focal-security main restricted universe multiverse
deb-src http://mirrors.aliyun.com/ubuntu/ focal-updates main restricted universe multiverse
deb-src http://mirrors.aliyun.com/ubuntu/ focal-proposed main restricted universe multiverse
deb-src http://mirrors.aliyun.com/ubuntu/ focal-backports main restricted universe multiverse
更新源
apt update
安装 OpenCV-4.5.0
OpenCV-4.5.0源码链接如下,下载 zip 包,解压后放到宿主机/home目录下,即容器的/workspace目录下
cp {ultralytics}/yolov5/para.wts {tensorrt}/
cd {tensorrt}/
mkdir images # and put some images in it# update CLASS_NUM in yololayer.h if your model is trained on custom dataset# you can also update INPUT_H、INPUT_W in yololayer.h, update NET(s/m/l/x) in trt_infer.cpp
make
./trt_infer
# result images will be generated in present dir
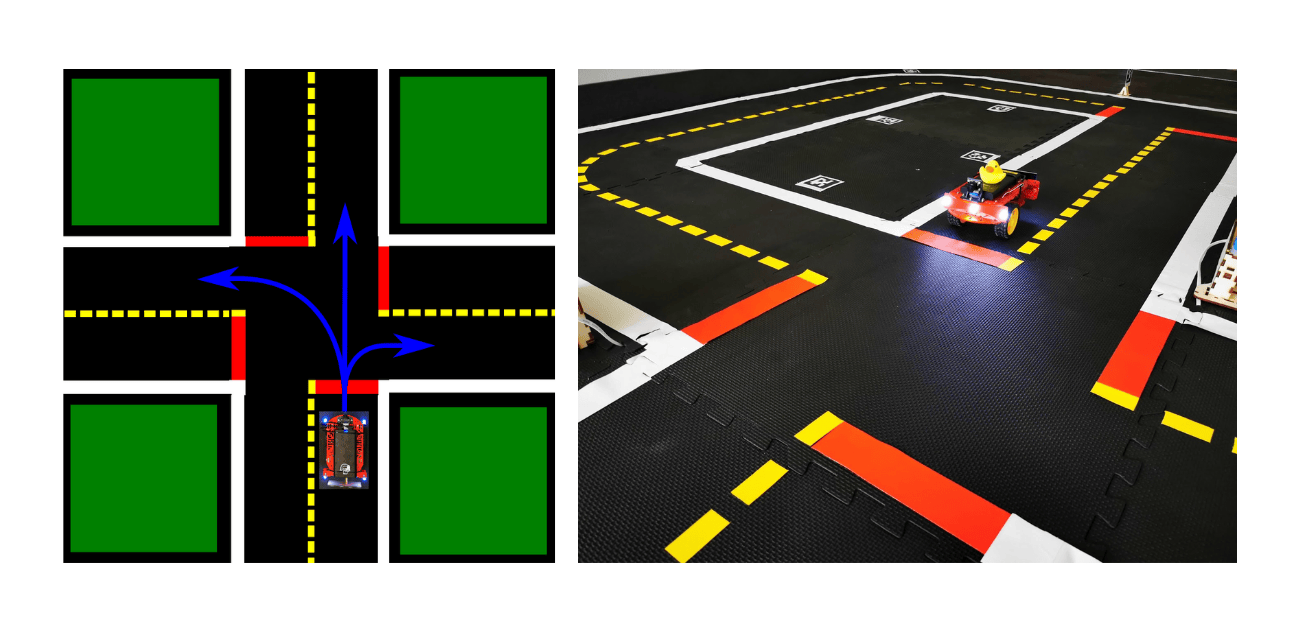
As part of the Duckietown class taught at ETH Zurich (Fall 2023), we worked on a small final project and presented it to other students as a group of three master students: Benjamin Dupont, Yanni Kechriotis, and Samuel Montorfani. We implemented an intersection navigation pipeline for the Duckiebots (small autonomous differential drive robots equipped with Nvidia Jetson Nano) to enable them to drive through intersections in the Duckietown road-like environment.
The pipeline consists of:
Perception: Detect intersections and other Duckiebots in the environment.
Decision Making: Decide which way to go and whether it is safe to proceed based on the detections. This includes applying a decision-making stack to determine priority and right of way.
Control: Steer the Duckiebot through the intersection.
The pipeline is implemented in Python and uses the ROS framework to communicate with the Duckiebot and other nodes in the system.
Project Overview
Scope
Detect intersections in Duckietown.
Detect other Duckiebots in the intersection.
Decide whether to stop, go, or turn based on other agents, using LED colors for communication.
Navigate the intersection by turning left, right, or going straight, depending on the intersection options.
Apply a decision-making stack to determine priority and right of way.
Assumptions
All sensors on the Duckiebots are assumed to be fully functional. The intersections are expected to be of standard size, with standard markings that are clearly visible, and without any obstructions such as buildings. Additionally, the Duckiebots are assumed to be of standard size and shape.
Finally, the code for the lane following is given by the instructors as it is part of the Duckietown software stack.
Challenges
The project faces several challenges that could lead to failure. One major challenge is the presence of multiple Duckiebots at an intersection, which can create symmetry issues and complicate decision-making. Delayed decision-making can also pose a risk, as it may lead to collisions or traffic jams. The limited field of view of the Duckiebots can hinder their ability to detect other robots and obstacles in time. LED detection issues can further complicate communication between Duckiebots. Additionally, random component failures can disrupt the navigation process. To mitigate these risks, we implemented a robust priority system and strategies to improve field of view, such as detecting Duckiebots while approaching intersections and turning in place to get a better view. We also assume that there is always a Duckiebot on the left and make random decisions after a certain time to prevent deadlocks at intersections.
Implementation details and results
The implementation of our intersection navigation project involved creating custom classes and functions to handle various tasks such as intersection detection, decision making, and control. The Duckiebot starts by following the lane and uses its camera to detect intersections by identifying red markers. Upon detecting an intersection, it stops and randomly chooses an action (straight, left, or right) based on the intersection type. The Duckiebot then signals its intended action using LEDs and checks for other Duckiebots at the intersection using a custom-trained YOLOv5 object detection model. This model provided reliable detection of other Duckiebots, which was crucial for the priority decision-making process. The Duckiebot follows standard traffic rules to determine right-of-way and uses motor encoders to execute the chosen action through the intersection.
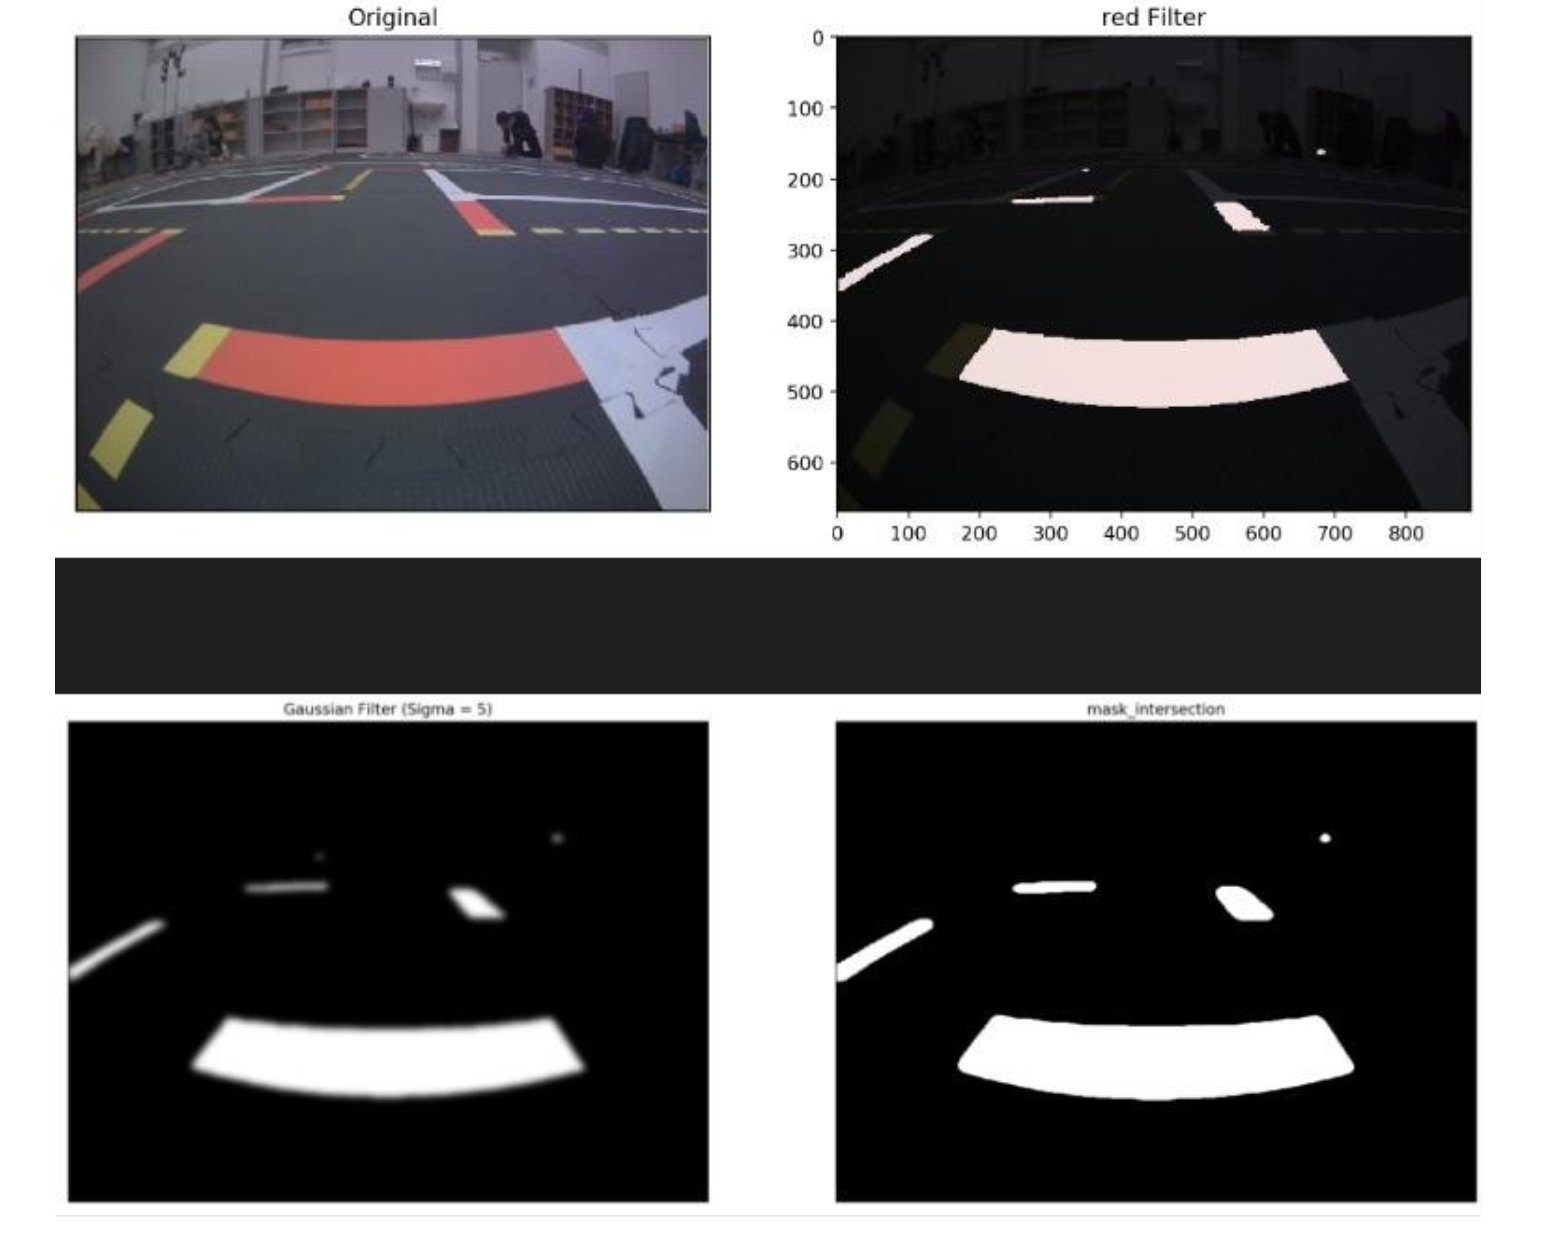
Perception
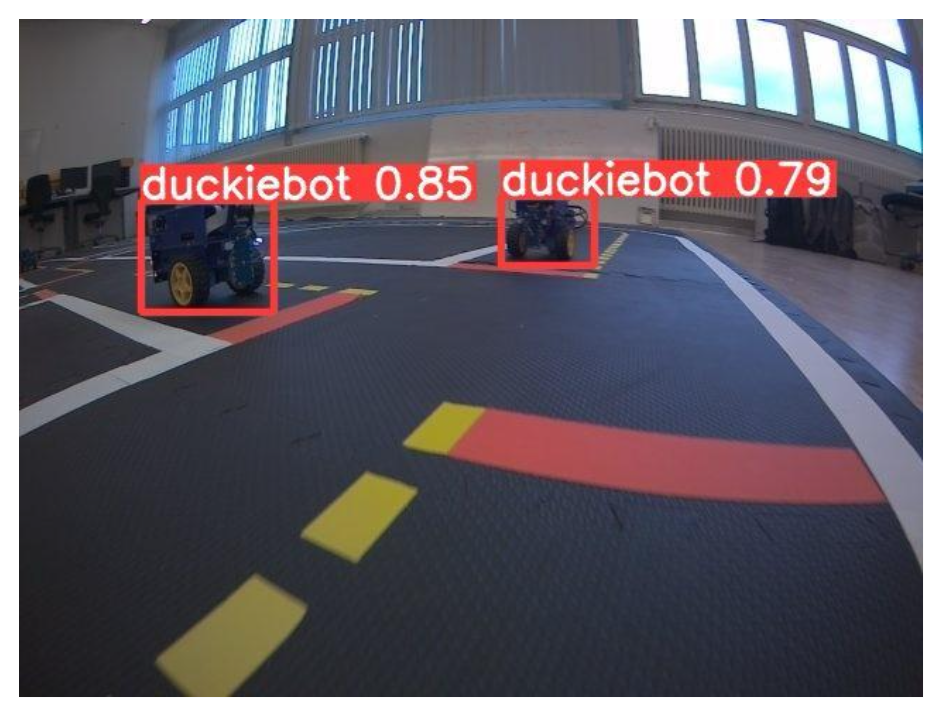
The perception module is responsible for detecting intersections and other Duckiebots in the environment. We used the Duckietown lane following code to detect intersections based on the presence of red markers. The intersection detection algorithm was implemented using OpenCV to identify the red markers and determine the intersection type (T-intersection or 4-way intersection) and possible options for the duckiebot to navigate to. We also trained a custom YOLOv5 object detection model to detect other Duckiebots at the intersection. The model was trained on a dataset of Duckiebot images and achieved high accuracy in detecting Duckiebots in various orientations and lighting conditions. The alternative for this was to use the LEDs on the Duckiebots to communicate with each other, but we decided to use the object detection model for more reliable results, as the LED strength could vary depending on the lighting conditions, and on most robots, only one LED was working. We then ran the LED detection in the bounding box of the detected Duckiebots to determine the color of the LED and the direction the Duckiebot was going to take. This information was used in the decision-making module to determine the Duckiebot’s next action. To determine in which position the other Duckiebots were, we used their bounding boxes in the camera pixel coordinates to infer their position relative to the Duckiebot. This information was used in the decision-making module to determine the Duckiebot’s priority and right of way.
“+” Intersection detection
YOLO v5 Detection
Decision Making
The decision-making module is responsible for determining the Duckiebot’s next action based on the detected intersections and other Duckiebots. Once the different options were detected, the Duckiebot randomly chose an action (straight, left, or right) based on the intersection type.
We implemented a priority system to handle multiple Duckiebots at an intersection and ensure safe navigation. The priority system assigns right-of-way based on the Duckiebot’s position relative to the other Duckiebots. The Duckiebot signals its intended action using LEDs to communicate with other Duckiebots and avoid collisions. This is used in complex cases where right of way is not sufficient. In the most simple case, the duckiebot just stays at a stop until the other duckiebot to the right has passed. In the case where the duckiebot is at a 4-way intersection, it will signal its intention to go straight, left, or right using the LEDs. If the duckiebot is at a T-intersection, it will signal its intention to go straight or turn using the LEDs. The decision-making module also includes a tie-breaking mechanism to resolve conflicts when multiple Duckiebots have the same priority. In these cases, the Duckiebot randomly chooses an action to prevent deadlocks and ensure smooth traffic flow. The decision-making module was implemented using a combination of if-else statements and priority rules to determine the Duckiebot’s next action based on the detected intersections and other Duckiebots. The priority system was designed to handle various scenarios and ensure safe and efficient navigation through intersections. It was however not fully completed and tested during the project, as the time was limited.
Control
Due to the limited time available for the project, we couldn’t implement a full estimation and control pipeline for the Duckiebots. Instead, we decided to opt for a brute force approach by calculating the inputs needed to achieve the desired action using open loop control. This was sufficient in most cases, and the lane following module was able to take over just at the end of the intersection to compensate for potential small errors and go back on track.
Additionaly, to mitigate the effect of misalignment of the Duckiebot when approaching the intersection, we added a small alignment step before the intersection, where the Duckiebot would turn in place to get a better view of the intersection and align itself with the lanes. Using the intersection detection and aligning it with a template, we were able to ensure the duckiebot was straight when scanning the intersection, effectively improving the detection accuracy but also the intersection navigation itself thanks to a more standardized starting pose.
Results
In terms of results, our systematic evaluation showed an intersection detection accuracy of approximately 90%, a turn completion rate of around 85%, and a Duckiebot detection accuracy of about 95%. However, we encountered some challenges, with crashes occurring about 10% of the time and off-road occurrences happening roughly 40% of the time, often due to camera delays, motor issues, or other hardware problems. These problems also arose due to the code running on our own laptops rather than the Duckiebot itself, which could have affected the real-time performance. Despite these challenges, our project demonstrated a successful implementation of intersection navigation for Duckiebots, and we received very positive feedback from our peers during the final presentation.
Demonstration Videos
You can watch a demonstration of the intersection navigation system in action with the following GIFs:
Single Duckiebot navigating through an intersection
Two Duckiebots navigating through an intersection
Three Duckiebots navigating through an intersection
For the full videos, with realistic performance, you can look in the folder /videos in the repository.
Note: As discussed in the challenges section, the videos show the Duckiebots running on our laptops rather than the actual Duckiebots, which could have affected the real-time performance. This affected the controls sent to the Duckiebots and the camera feed, leading to some crashes and off-road occurrences.
Additionaly, the videos also show the sometime inaccurate lane following code, which was out of scope and given to us by the instructors, which was also an assumption made in the project.
Conclusion and Future Work
In conclusion, our project successfully implemented an intersection navigation system for Duckiebots, achieving high accuracy in intersection detection and Duckiebot recognition. Despite hardware and software integration challenges, we demonstrated the feasibility of autonomous intersection navigation in Duckietown. The project met our initial goals, although the combined execution of actions revealed areas for improvement, particularly in handling delays and hardware reliability.
For future work, several extensions could enhance the Duckiebots’ capabilities. Developing a more robust tie-breaking mechanism for four-way intersections and ensuring the system can handle non-compliant or emergency Duckiebots would improve reliability. Implementing traffic light-controlled intersections and enabling multiple Duckiebots to navigate intersections simultaneously with minimal constraints on traffic density would significantly advance the system’s complexity and utility. Better integration of the code into the component framework would streamline development and debugging processes.
Achieving these improvements would require substantial effort, particularly in enhancing hardware reliability and refining the software framework. Despite the challenges, the potential advancements would unlock new skills for the Duckiebots, making them more versatile and capable in complex environments. Given the limited time we had for this project, we would have liked to have more time to work on these aspects as the schedule was quite tight.
Overall, we are satisfied with our project’s outcomes and the learning experience it provided. The insights gained will inform future developments and contribute to the broader field of autonomous robotics.
Design Document
The design document for the project can be found in the /design_document folder. It contains a pdf document exported from the word document that we filled in throughout our work, outlining the design choices, implementation details, and challenges faced during the project.
This library is currently under active development. Check out the current status for a list of implemented commands.
Consider contributing if you need a specific command:
Check src/api/index.ts for current implementation
Add your needed command following the same pattern
Open a Pull Request
✨ Features
🔒 Fully Type-Safe: End-to-end type safety for all API calls, including async operations
📄 OpenAPI Support: Generated spec for integration with any language/client
🧩 Framework Agnostic: Works with any fetch client
🚀 Async Operations: First-class support for Rclone’s async operations
✅ Runtime Validation: Uses Zod to validate types at runtime
💪 HTTP Status Handling: Error responses handled through typed status codes
Installation
# Using npm
npm install rclone-rc

# Using yarn
yarn add rclone-rc

# Using pnpm
pnpm add rclone-rc
Usage
Basic Client
import{createClient}from'rclone-rc';constapi=createClient({baseUrl: 'http://localhost:5572',username: 'your-username',// Optional if running with --rc-no-authpassword: 'your-password',// Optional if running with --rc-no-auth});try{// Get rclone version with typed responseconst{ status, body }=awaitapi.version();if(status===200){console.log('Rclone version:',body.version);// typed}elseif(status===500){console.log('Error:',body.error);// also typed}// List files with type-safe parameters and responseconstfiles=awaitapi.list({body: {fs: 'remote:path',remote: ''}});if(files.status===200){console.log('Files:',files.body.list);}}catch(error){// Only network errors will throw exceptionsconsole.error('Network error:',error);}
Error Handling
This library handles errors in two ways:
HTTP Status Errors: Returned as typed responses with appropriate status codes
Network Errors: Thrown as exceptions when server is unreachable
Async Operations
For long-running operations:
import{createClient,createAsyncClient}from'rclone-rc';constapi=createClient({baseUrl: 'http://localhost:5572'});constasyncApi=createAsyncClient({baseUrl: 'http://localhost:5572'});try{// Start async jobconstjob=awaitasyncApi.list({body: {fs: 'remote:path',remote: '',_async: true,// You need to pass this flag to the async client}});// Access job ID and check statusconstjobId=job.body.jobid;// Check job status using the non-async clientconststatus=awaitapi.jobStatus({body: {jobid: jobId}});if(status.status===200&&status.body.finished){console.log('Job output:',status.body.output);}}catch(error){console.error('Network error:',error);}
Runtime Type Validation
Zod validates both request and response types at runtime:
Request validation: Parameters, body, and query are validated before sending
Response validation: Can be disabled with validateResponse: false in client options
constapi=createClient({baseUrl: 'http://localhost:5572',validateResponse: false,// true by default});
OpenAPI Integration
Generate an OpenAPI specification for use with other languages and tools:
I’ve implemented the SR process using TensorRT, incorporating a custom frame division algorithm designed to accelerate it. This algorithm includes a video redundancy jump mechanism, akin to video compression Inter-Prediction, and a momentum mechanism.
Additionally, I’ve employed FFMPEG to decode the video at a reduced frames-per-second (FPS) rate, facilitating faster processing with an almost imperceptible drop in quality. To further optimize performance, I’ve utilized both multiprocessing and multithreading techniques to fully utilize all available computational resources.
In my 3060Ti Desktop version, it can process in Real-Time on 480P Anime videos input (Real-CUGAN), which means that as soon as you finish watching one Anime video, the second Anime Super-Resolution (SR) video is already processed and ready for you to continue watching with just a simple click..
Currently, this repository supports Real-CUGAN (official) and a shallow Real-ESRGAN (6 blocks Anime Image version RRDB-Net provided by Real-ESRGAN).
My ultimate goal is to directly utilize decode information in Video Codec as in this paper (https://arxiv.org/abs/1603.08968), so I use the word “FAST” at the beginning. Though this repository can already process in real-time, this repository will be continuously maintained and developed.
If you like this repository, you can give me a star (if you are willing). Feel free to report any problem to me.
Nvidia GPU with Cuda (Tested: 2060 Super, 3060Ti, 3090Ti, 4090)
Tested on Python 3.10
Installation (Linux – Ubuntu):
Skip step 3 and 4 if you don’t want tensorrt, but they can increase the speed a lot & save a lot of GPU memory.
Install CUDA. The following is how I install:
My Nvidia Driver in Ubuntu is installed by Software & Updates of Ubuntu (Nvidia server driver 525), and the cuda version in nvidia-smi is 12.0 in default, which is the driver API.
After finishing the cuda installation, we need to add their path to the environment
gedit ~/.bashrc
// Add the following two at the end of the popped up file (The path may be different, please double check)
export PATH=/usr/local/cuda-12.0/bin${PATH:+:${PATH}}export LD_LIBRARY_PATH=/usr/local/cuda-12.0/lib64${LD_LIBRARY_PATH:+:${LD_LIBRARY_PATH}}
// Save the file and execute the following in the terminal
source~/.bashrc
You should be capable to run “nvcc –version” to know that cuda is fully installed.
gedit ~/.bashrc
// Add the following at the end of the popped up file (The path may be different, please double check)
export LD_LIBRARY_PATH=/home/YOUR_USERNAME/TensorRT-8.6.1.6/lib${LD_LIBRARY_PATH:+:${LD_LIBRARY_PATH}}
// Save the file and execute the following in the terminal
source~/.bashrc
After finishing these steps, you should be able to “import tensorrt” in python (starts a new window to run this)
Install torch2trt (Don’t directly use pip install torch2trt)
Adjust config.py to setup your setting. Usually, just editing Frequently Edited Setting part is enough. Please follow the instructions there.
Edit process_num, full_model_num, nt to match your GPU’s computation power.
The input (inp_path) can be a single video input or a folder with a bunch of videos (video format can be various as long as they are supported by ffmpeg); The output is mp4 format in default.
Run
python main.py
The original cunet weight should be automatically downloaded and tensorrt transformed weight should be generated automatically based on the video input height and weight.
Usually, if this is the first time you transform to a tensorrt weight, it may need to wait for a while for the program to generate tensorrt weight.
If the input source has any external subtitle, it will also be extracted automatically and sealed back to the processed video at the end.
Future Works:
Debug use without TensorRT && when full_model_num=0
MultiGPU inference support
Provide PSNR && Visual Quality report in README.md
Provide all repositories in English.
Record a video on how to install TensorRT from scratch.
Disclaimer:
The sample image under tensorrt_weight_generator is just for faster implementation, I don’t have a copyright for that one. All rights are reserved to their original owners.
Adjust chaos2redis to pin long_spin() and time_spin() to the same thread
Default: long_spin() and time_spin() will each spin their own thread
-e SAVEACORE=1
Adjust chaos2redis to acquire 6 blocks of chaos per thread before transmutation
Default: 4 blocks of chaos per thread
-e CHAOS=6
Adjust chaos2redis to use 2 hashing cores for chaos transmutation
Default: 1 hashing core
-e CORES=2
Adjust chaos2redis to keep 25 lists of 999999 random numbers in redis
Default: 10 lists of 100000 random numbers each
-e LISTS=25 -e LSIZE=999999
Launch chaos-dispensary docker container
Run chaos-dispensary binding to 172.17.0.1:80 using default configuration
docker run -d -p 172.17.0.1:80:8080 fullaxx/chaos-dispensary
Run chaos-dispensary binding to 172.17.0.1:80 using a conservative configuration
docker run -d -e SAVEACORE=1 -e CHAOS=2 -p 172.17.0.1:80:8080 fullaxx/chaos-dispensary
Run chaos-dispensary binding to 172.17.0.1:80 using a multi-core configuration
docker run -d -e CORES=4 -p 172.17.0.1:80:8080 fullaxx/chaos-dispensary
Using curl to retrieve random numbers
By default the output will be a space delimited string of numbers.
If the header Accept: application/json is sent, the output will be json.
Get 1 number from the dispensary:
The status node consists of two values. Chaos/s is the amount of chaos pouches that we’re processing per second. Numbers/s is the amount of random numbers we’re generating per second.
The ask program prompts the user and accepts a single-key response.
Usage:
ask [options] “prompt string” responses
The options can appear anywhere on the command line.
Options
Description
-c, -C, –case-sensitive
Case-sensitive response matching
-h, -H, –help
Show this help screen
The “prompt string” and responses are positional parameters. They must be in order.
Positional Parameter
Description
“prompt string”
The prompt string the user sees
responses
The characters the user is allowed to press to answer the prompt (Not a comma-separated list.)
Return value:
System Exit Code
Meaning
0
The user entered a response that was not in the allowed responses.
1-125
The index of the user’s choice in the responses. (The first response is 1, the next is 2, and so on.)
126
The user pressed Enter without making a choice
127
The user pressed Escape
System Exit Code: In an sh-compatible shell, you check the ?* variable.
In a batch file you check the ERRORLEVEL.
Other shells may be different.
Usage Notes:
The user must press Enter after pressing a key.
The response is not case-sensitive by default. Use -c if case-sensitive mode is necessary.
If the user presses more than one key, the first key will be used. The user can use the keyboard to edit their response.
The escape sequences \, \a, \n, \r, and \t are allowed in the prompt string.
Example:
ask “** Answer [Y]es, [N]o, or [M]aybe: ” YNM
The example displays the following prompt, and reads the user’s response:
** Answer [Y]es, [N]o, or [M]aybe:
The example returns:
Exit code 1 if the user pressed y or Y.
Exit code 2 if the user pressed n or N.
Exit code 3 if the user pressed m or M.
Exit code 0 if the user pressed a key that was not y, Y, n, N, m, or M.
Exit code 126 if the user pressed Enter without pressing a key.
Exit code 127 if the user pressed Escape.
Programming Notes
You can include the ask_funcs.h header and link the ask_funcs.o module to your own C/C++ programs. This provides your programs the same functionality used by the ask program.
It uses standard C library functions for I/O. It uses the standard putchar() function to print the prompt string to stdout, and the standard getchar() function to read the response character from stdin.
Functions
The ask_funcs module provides the following public functions:
void set_default_options();
void set_case_sensitive_mode(int value);
int ask(char *prompt, char *response_list);
void set_default_options();
The set_default_options function simply sets the default case_sensitive mode option to OFF (0).
void set_case_sensitive_mode(int value);
The set_case_sensitive_mode function lets you turn the case sensitive mode ON (non-zero) or OFF (0).
int ask(char *prompt, char *responses);
The ask function lets you prompt the user, specifying the prompt string and the response characters, and then receive the response code.
The return value from the ask function is the same as the system exit codes described for the ask program.